P-Values: Navigating the Maze of Statistical Significance
Dive into the essentials of p-values and dispel common myths with our concise guide, designed to clarify statistical significance and empower your research with confidence.
STATISTICS
In the realm of statistical analysis, especially Six Sigma, p-values have long stood as a cornerstone for deciding the outcome of hypotheses. They guide researchers through the dense fog of data towards conclusions about what holds true and what doesn’t.
Yet, the journey isn’t as straightforward as we often think. There are several examples where p-values are often misused or misunderstood. The topic was so big that the American Statistical Association (ASA) released a publication that aimed to realign people's understanding and usage of p-values [1]. David Trafimow published another article in Basic and Applied Social Psychology, concluding that p-values should be banned altogether! I think the latter is a little extreme, but I can at least understand the frustration.
Hopefully, we'll be able to decode the p-value. In many ways, it's much simpler than we think. We just need to use it pragmatically.
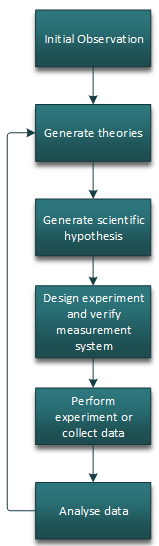
In any scientific exploration, we are trying to learn our way to new theories and ideas. We do this by generating hypotheses, testing them, and learning from them to figure out our next steps.
We use hypothesis testing as a mechanism to help us do the ‘analyse data’ part, after we have presumably created a robust method of collecting said data and verified it’s integrity. Before any experiment takes place though, we need to generate our hypotheses (cue nightmares from your lean six sigma courses…):
Understanding Hypotheses

Alternative hypothesis – there is a difference between X situation and Y
This is usually what we want to be true, be it seeing if a new vaccine works, or whether a process has genuinely improved following some changes.
This suggests X and Y come from different populations.
Null hypothesis – there is no difference between X situation and Y
This can be described as the devil’s advocate of your theory, in that whilst we might desire a change, the fact remains that there might not really be any change at all.
This suggests X and Y come from the same population.
The key point is that the null hypothesis suggests that any difference we see is probably due to chance or sampling error and not something truly different.
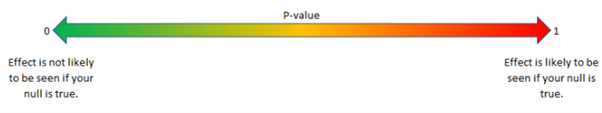
The p stands for probability (p) value. It is the probability of the observed (or more extreme) results, if the null hypothesis were true. The null hypothesis typically being that an action taken has no effect on a result. This describes the probability or chance of seeing your observed data if the treatment you implemented had no effect. Or in more correct terms, how likely are you to see the effect, if your null hypothesis was true.
Higher p-values suggest that your data is likely to be seen if your treatment had no real effect. Lower p-values therefore suggest that your data is not likely to be seen if your treatment had no real effect.
What are p-values then?
This is the technical definition of a p-value and hopefully shows that it is the probability of the data being observed, not a hypothesis being true. Typically, we set the alpha level at 0.05. This value indicates the risk of type 1 error we are willing to accept. However, this does not mean that the p-value is the actual calculated risk. But lets try and make it easier to understand.
Sir Ronald Fisher poses a good experiment to demonstrate the effective understanding of a p-value [2]. A colleague of his named Dr. Bristol posed the theory that she is able to taste a cup of tea and tell whether the milk was added before pouring the tea, or whether the milk was added after pouring the tea. Of course, this would be a remarkable (but perhaps very useless) skill, but lets put it into practice – I have 2 cups of tea, A and B. One the milk was put in first, the second the milk was put in last, this was done secretly away from our milk psychic Dr. Bristol.
Understanding p-values with an example:


We give both cups to Dr. Bristol and she correctly identifies that cup A was the one with the milk put in first – remarkable! But was it likely we would have seen this elsewhere? In a way, was this just luck or chance? – well with only 2 cups, the odds are 50/50, in other words, the probability that this was down to random chance was 50% or 0.5… (aha, a p-value!).
Are we happy with Dr. Bristol's claim being true given we have just calculated our p-value which is that this was possibly just 50% down to chance? Probably not, because in a sense, this p-value is suggesting that with anyone else, we could see the same results (selecting the correct cup of tea) 50% of the time. In other words, out of 100 random other people, 50 of them could do the same as Dr. Bristol here.
Fisher devised a simple yet elegant experiment from this. He prepared eight cups of tea. For four of these cups, he poured the tea into the cup before adding milk, and for the other four, he poured the milk in before the tea. The order was randomised to ensure that the experiment was not biased by the sequence of preparation. This was crucial to isolate the variable being tested—Dr. Bristol's ability to distinguish the order of pouring—while minimising the influence of other factors. We can generate our 2 hypotheses based off of this too:
The null hypothesis (H0) in this context was that Dr. Bristol could not distinguish between the two types of preparations and that any correct identifications would be due to chance alone.
The alternative hypothesis (H1) was that she could indeed make the distinction as claimed.
Dr. Bristol was then asked to taste all eight cups and identify which of them had tea poured first and which had milk poured first. Her task was to correctly categorise all the cups based on her claimed ability. This ability to distinguish between the cups would then be statistically analysed. This would determine if her correct identifications were significantly beyond what would be expected by chance (hence the technical definition in the previous section). If she guessed correctly more often than would be likely by random chance (given the number of cups and the 50/50 chance of being correct for each guess), Fisher could calculate the probability (p-value) of observing such a result if the null hypothesis were true.
In the real experiment, Dr. Bristol correctly identified all the cups, and in reality, the chance of getting all eight correct by guessing would be roughly 1/70 = 1.4% or p=0.014. Therefore, Fisher concluded that the results were statistically significant, and the null hypothesis that she was guessing was rejected. In other words, her correct results are unlikely due to luck alone. The likelihood is only 0.014 or 1.4%, which suggests Dr. Bristol is some kind of remarkable tea wizard*.
As you can see here, the p-value is not a measure of how accurate your hypothesis is. It also does not show the likelihood that you might be drawing an incorrect conclusion. The p-value simply determines how compatible your data is with a theory. In this case, Dr. Bristol’s results, are not compatible with our null hypothesis, as the likelihood of doing this by pure luck was incredibly low (indicated by the low p-value), hence we have more evidence supporting the alternative and are more likely to go with that conclusion.
To help understand the definitions above, it is good to clarify some key misconceptions here of what a p-value is NOT and I’ll go on to explain why for each.
Common Misconceptions
This is the most commonly stated definition that isn’t correct and can be hard to get around. But stay with me here because this isn't semantics.
A hypothesis test inherently assumes that the null hypothesis is true, and that observations were down to "chance". Which means that the p-value does not tell you whether the hypothesis is true or not (and therefore type 1 error) as it calculates off the assumption that the null is 100% true:
If I want to test if a coin is biased, I can flip a coin several times and see if it gives results that are indicative of a fair coin.
Null (H0) = the coin is fair.
Alternative (HA) = the coin is not fair (biased).
I toss the coin 10 times, and get 8 heads, and 2 tails, this would result in a p-value of 0.04, in other words,
This does not mean that the chance that the coin is fair is 4%. Nor does it mean that the type 1 error is 4% either. The type 1 error rate was pre-determined at 0.05 for our alpha (5%). The type 1 error rate was determined before the experiment, not after.
What it does mean is, if the coin were fair, results like 8 heads in 10 flips would only happen about 4% of the time.
This would lean towards suggesting the coin could well be biased.
In the long run then, this hypothesis test is also saying that if I were to repeat this experiment several times over, I will reject the null hypothesis about 5% of the time - because that it what I pre-determined before analysing the data. If the coin was indeed fair, I would incorrectly conclude that it is biased about 5% of the time.
If you run a test and get a p-value of 0.04, that’s statistically significant at the 0.05 level. Now suppose the null was actually true. In that case, by rejecting it you’ve committed a Type I error — you’ve concluded there is a difference when in reality there wasn’t. But notice that this does not mean the risk of Type I error was 4%. The risk of Type I error is fixed at 5% (α = 0.05), because that’s what you set before the experiment. The p-value of 0.04 simply tells you how rare your observed data would be if the null were true. You then compare it to α (0.05) to form a decision.
Sellke et al. [3] have already done research in this matter, and actually show that the true error rates in low p-values are often much higher. For example, they show that with a p-value of 0.05, the actual calculated type 1 error rate was at least 23%. 23% is the actual risk, not the p-value (hence, this isn't just semantics)! According to the research by Sellke et al., depending on how you interpret the data and what your prior beliefs are, the chance that you're making an incorrect decision could actually be much higher than the p-value or alpha risk.
If you want to look into concepts like this a little more, check out "Base Rate Fallacy".
p-value is not the probability of type 1 error.
Yes, this is despite how I explained the tea experiment above. But seeing the p-value as the likelihood of something being down to chance is a good starting point of a definition, now we are just refining it slightly.
If I conduct an experiment where I pose a very advanced mathematical formula to my cat Freddie, and ask Freddie to select 1 of 2 potential answers on a card, by putting his paw on the correct answer. Let’s say Freddie gets the correct answer to my formula and we calculate a p-value from this like we did in our tea experiment… 0.5 or 50%. In other words, the likelihood of Freddie the cat picking the correct answer by chance was just 50%, right? Wrong. It was 100% chance, because…he is a cat (as much as I love him, he’s not Einstein).
The reality is the p-value cannot distinguish between whether that was chance or not. The p-value simply told me what the probability of me was observing that situation assuming hypothetically that the null is true. The p-value can only theoretically make this distinction if the only possible explanation left was random chance.
p-value is not the result being down to chance alone.

This is by far the biggest (and I would argue most important) mistake in applying p-values in many Lean Six Sigma contexts that I see, which is solely relying on the p-value to draw conclusions is a mistake. As the American Statistical Association also say: “Scientific conclusions and business or policy decisions should not be based only on whether a p-value passes a specific threshold.”
Ultimately, a p-value only tells you about the statistical significance of an effect. It doesn't tell you whether that effect size is meaningful or important. Vice versa, you can have practical effects of importance that still might not be statistically significant.
To give another odd example, let’s say I am a business analyst who suspects people are clocking out of work early. They should be clocking out once they have completed 8 hours of work. Now, if I hypothetically collected 30 samples of clock out times and every single one of them said the person clocked out after either 7.99 or 7.98 hours of work, not 8 (this is about 30 seconds). Then, I ran a 1-sample t-test to evaluate if there is a statistical difference between our actual clock out times and the target of 8 hours.
You’ll find the p-value will be 0.000 with a very tight confidence interval. Therefore, they are statistically different, and very clearly so. It is so clear that 7.99 is different to 8.00 that I probably didn’t need the hypothesis test to tell me that, however what it doesn’t establish is whether that 30 second gap is meaningful or not. Perhaps it is, perhaps it isn’t. On an individual basis, the company might not care that people clock out 30 seconds early, it’s just 30 seconds. The practical implication from this perspective is negligible. So even though my hypothesis test said there was a clear statistical difference, the practical difference is virtually nothing, and therefore it doesn’t matter anyway. Some might argue that 30 seconds across lots of people IS meaningful to a business, I wouldn’t disagree with this, but hopefully you understand the point.
What it does go to show however, and what I often train with clients, is how problematic it can be making decisions from a p-value against an alpha threshold. Ultimately, the alpha is an arbitrary line of risk. In application, it means we could say that a p-value of 0.051 is NOT statistically significant, and a p-value of 0.049 IS statistically significant... when in reality all this shows was that the difference between the 2 was as little as 0.2% chance, is that really a suitable way of generating a conclusion? Maybe, maybe not. Going back to the point that the ASA make, key decisions should not be made based on whether a p-value meets a given threshold, but instead the full picture of the analysis should be reviewed.
p-values give no indication to the practical impact of a data set.


The important takeaway of these examples is, as with any statistics, you should always be pragmatic and practical in your assessments. Statistics does not replace experience and knowledge, it collaborates with it, and you should always look at what the statistics tell you, with what your knowledge, experience, and what the practical implications tell you too.
Going to the gemba is useless without the data for direction and context.
Relying on just data is useless without going to the gemba to see the reality.
And with this, when evaluating p-values, once you understand what they are really inferring, you should always use it with other analysis, look at the practical significance and use your observations to provide context and meaning to the results, the p-value is just 1 piece of the jigsaw.
In summary
"Statistics do not speak for themselves"
Milton Friedman
[1] Ronald L. Wasserstein & Nicole A. Lazar (2016) The ASA Statement on p-Values: Context, Process, and Purpose, The American Statistician, 70:2, 129-133, DOI: 10.1080/00031305.2016.1154108 - The ASA Statement on p-Values: Context, Process, and Purpose
[2] Fisher, Ronald (1935) The Design of Experiments - The design of experiments. (apa.org)
[3] Thomas SELLKE, M. J. BAYARRI, and James O. BERGER, Calibration of p-values for Testing Precise Null Hypotheses, The American Statistician, February 2001, Vol. 55, No. 1
References
*Some wonder where 1/70 = 1.4% comes from. As opposed to general probability which would indicate the probability is 1/256 (0.5^8). This is simply because the parameters of this experiment are known and the events are not independent. In total there are 70 possible combinations of tea, and therefore the probability of Dr. Bristol getting the right combination of them all is 1/70. This tea experiment shows the determination of each cup is also dependent on the previous one, hence they are not independent events. If each tea taste was totally independent, then instead the probability would be 1/256 = 0.7% (even more wizardry!). But the p-value is assessing the former, not independent events.
Syniad CI Ltd.
VAT Registered in UK.
Registered: 11329238
Contact Us
enquiries@syniad.uk
+44 292 277 2786
Our Trusted Collaborators