Understanding Control Chart Detection Rules
Arriving at the 100th Anniversary of Control Charts, we commend the work of Walter A. Shewhart and those that followed in the development of what is a very simple and effective tool that is often grossly misunderstood or under-utilised. This is especially relevant to 'detection rules' we use in control charts, let's explore those...
STATISTICS
In the realm of statistical analysis in problem solving (especially Six Sigma), Statistical Process Control or Control Charts are a commonly taught and used statistical tool, however we find it can often become overly complex in it's teachings, or quite often they can be totally misunderstood. The reality of control charts is actually very simple, and I would argue only serves as an all-round benefit when used appropriately.
Firstly, if you want to know the history of Shewhart's control charts, check out these wonderful articles by Dennis Crommentuijn-Marsh:
This brief article however intends to focus on the detection rules that have since evolved from Shewhart's original memo in truly understanding their usage and benefit to you.
There is always one simple picture that we like to use to demonstrate the fundamental purpose of a control chart in a nutshell...
The (Brief) Purpose of the Control Chart
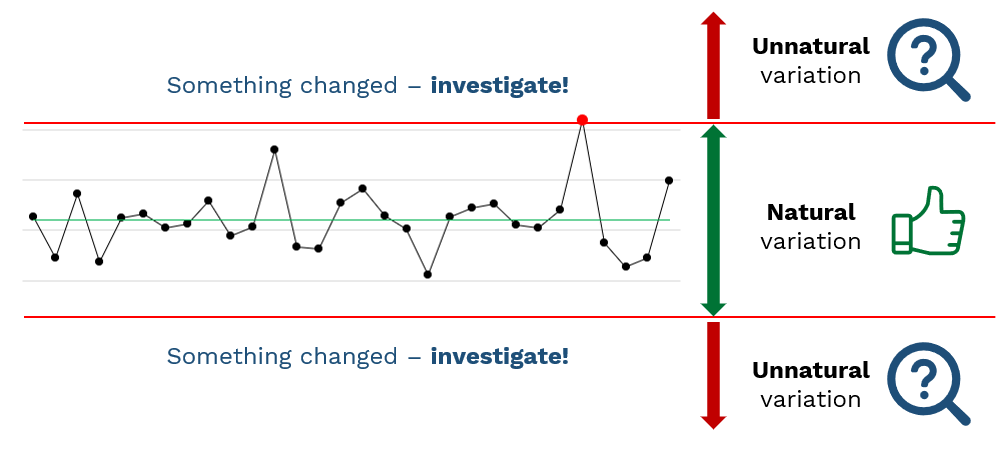
Like any form of graph or graphic, it is there to visualise something to make a certain piece of information clearly visible and understandable to anyone walking past. The fundamental premise of the control chart is to help visualise when unnatural variation may have occurred in a data set / process that may have a knowable cause. In other words, it helps you see when something changed in the process or to check if you have made a significant change to a process yourself - this change may be desired, or undesired.
The point is, if you see signs of unnatural variation, go and investigate, learn from it, and take action to address it if needed.
It is worth briefly defining what we mean by these types of variation, as through the evolution of statistical process control, inevitably means many people have gotten their hands in the pie and created their own terminology. What we'll do here is quickly cover the different terminology you might use and what we really mean when we say it:
Types of Variation
There are various reasons why these terms came to be, most of them trivial, but that is the way of data! For eases sake, I will clarify the terminology I prefer to use is Natural and Unnatural variation as I think holistically, this is the most applicable definition to any situation and I find makes it easier for many to understand. The purpose of Shewhart's control chart is to help distinguish between these two types of variation, in a clear, visual, and convenient way.
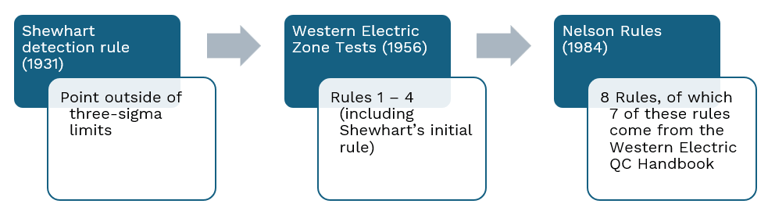
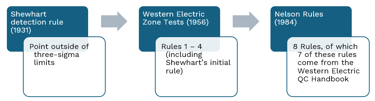
This is where detection rules come into play, and there has been some small evolution over time. The two most common sets of rules (or guidelines) I see being utilised across industries are the Western Electric rules, and the Nelson rules, and there can be some debate on which one to use. Ignoring other methods that have been developed or utilised, a very oversimplified timeline of these is:
Whilst there is debate on their usage, the reality is that each tried to enhance the previous, and each was based off of Shewhart's fundamental principles, but their usage has since exploded and as such, probably been misunderstood also. Nelson Rule's were mostly just an attempt of 'standardising' practice from the original Western Electric Handbook to try and have more consistent application of them.
Let's begin to explain how you can use these in the most appropriate way depending on your situation, and explain why using all of them without thought is actually problematic. We'll try to clearly show what the rules are across both Western Electric and Nelson, but there is only so much I can apologise for in remembering what number is in what system - and the last thing I want to do is create an entirely new numbering system.
The Detection Rules Explained
The simple fact of the matter is that as you add more detection rules, your false alarm rate goes up. If I keep asking a chart to "look for this pattern, now this pattern, oh and this pattern, and yes, that pattern too", then eventually it will match a pattern and give a signal. This is akin to 'throwing everything at the wall and seeing what sticks'. Something will eventually stick, you have to balance whether the additional rule is worth the potential response it might create.
This isn't saying never apply additional rules, but apply them in the situations that you need them and if and when appropriate. If you are ever in doubt of how to appropriately use them, I often like to describe the detection rules for dummies:
Rule 1 will capture the vast majority of cases where control charts will be useful to an organisation.
If you need more than this, using the 4 Western Electric Zone (Nelson rules 1, 2, 5 and 6) tests give more resolution without significantly increasing false positive rates.
Nelson rules may provide the rules to help you in given situations, especially when setting up the control chart.
The Problem With These Rules
"Assignable causes of variation may be found and eliminated"
Walter A. Shewhart
Syniad CI Ltd.
VAT Registered in UK.
Registered: 11329238
Contact Us
enquiries@syniad.uk
+44 292 277 2786
Our Trusted Collaborators